> ## Documentation Index
> Fetch the complete documentation index at: https://steadyrenew.com/docs/llms.txt
> Use this file to discover all available pages before exploring further.
# Reports and PDF export
> Review spending analytics in the Advanced Report and export print-ready A4 PDF reports.
# Reports and PDF export
The Advanced Report turns your subscription list into spending analytics: totals, category breakdowns, top subscriptions, and renewal patterns. You can read it in the app or export it as a print-ready A4 PDF.
## Open the Advanced Report
1. Open the dashboard.
2. Choose **View Advanced Report**.
The report uses your current base currency and exchange rates. Amounts charged in other currencies are converted to the base currency for totals and comparisons.
## Export a PDF
Two export variants are available at the top of the Advanced Report:
* **Export snapshot** — a compact summary of where your spending stands today: monthly and annualized totals, category breakdown, the subscription table, and charges due in the next 30 days. If that content does not fit on one A4 page, it continues on additional A4 pages.
* **Export annual report** — a year-view report with the monthly spend trend, top subscriptions by spend, and category totals. Long subscription lists continue on additional A4 pages.
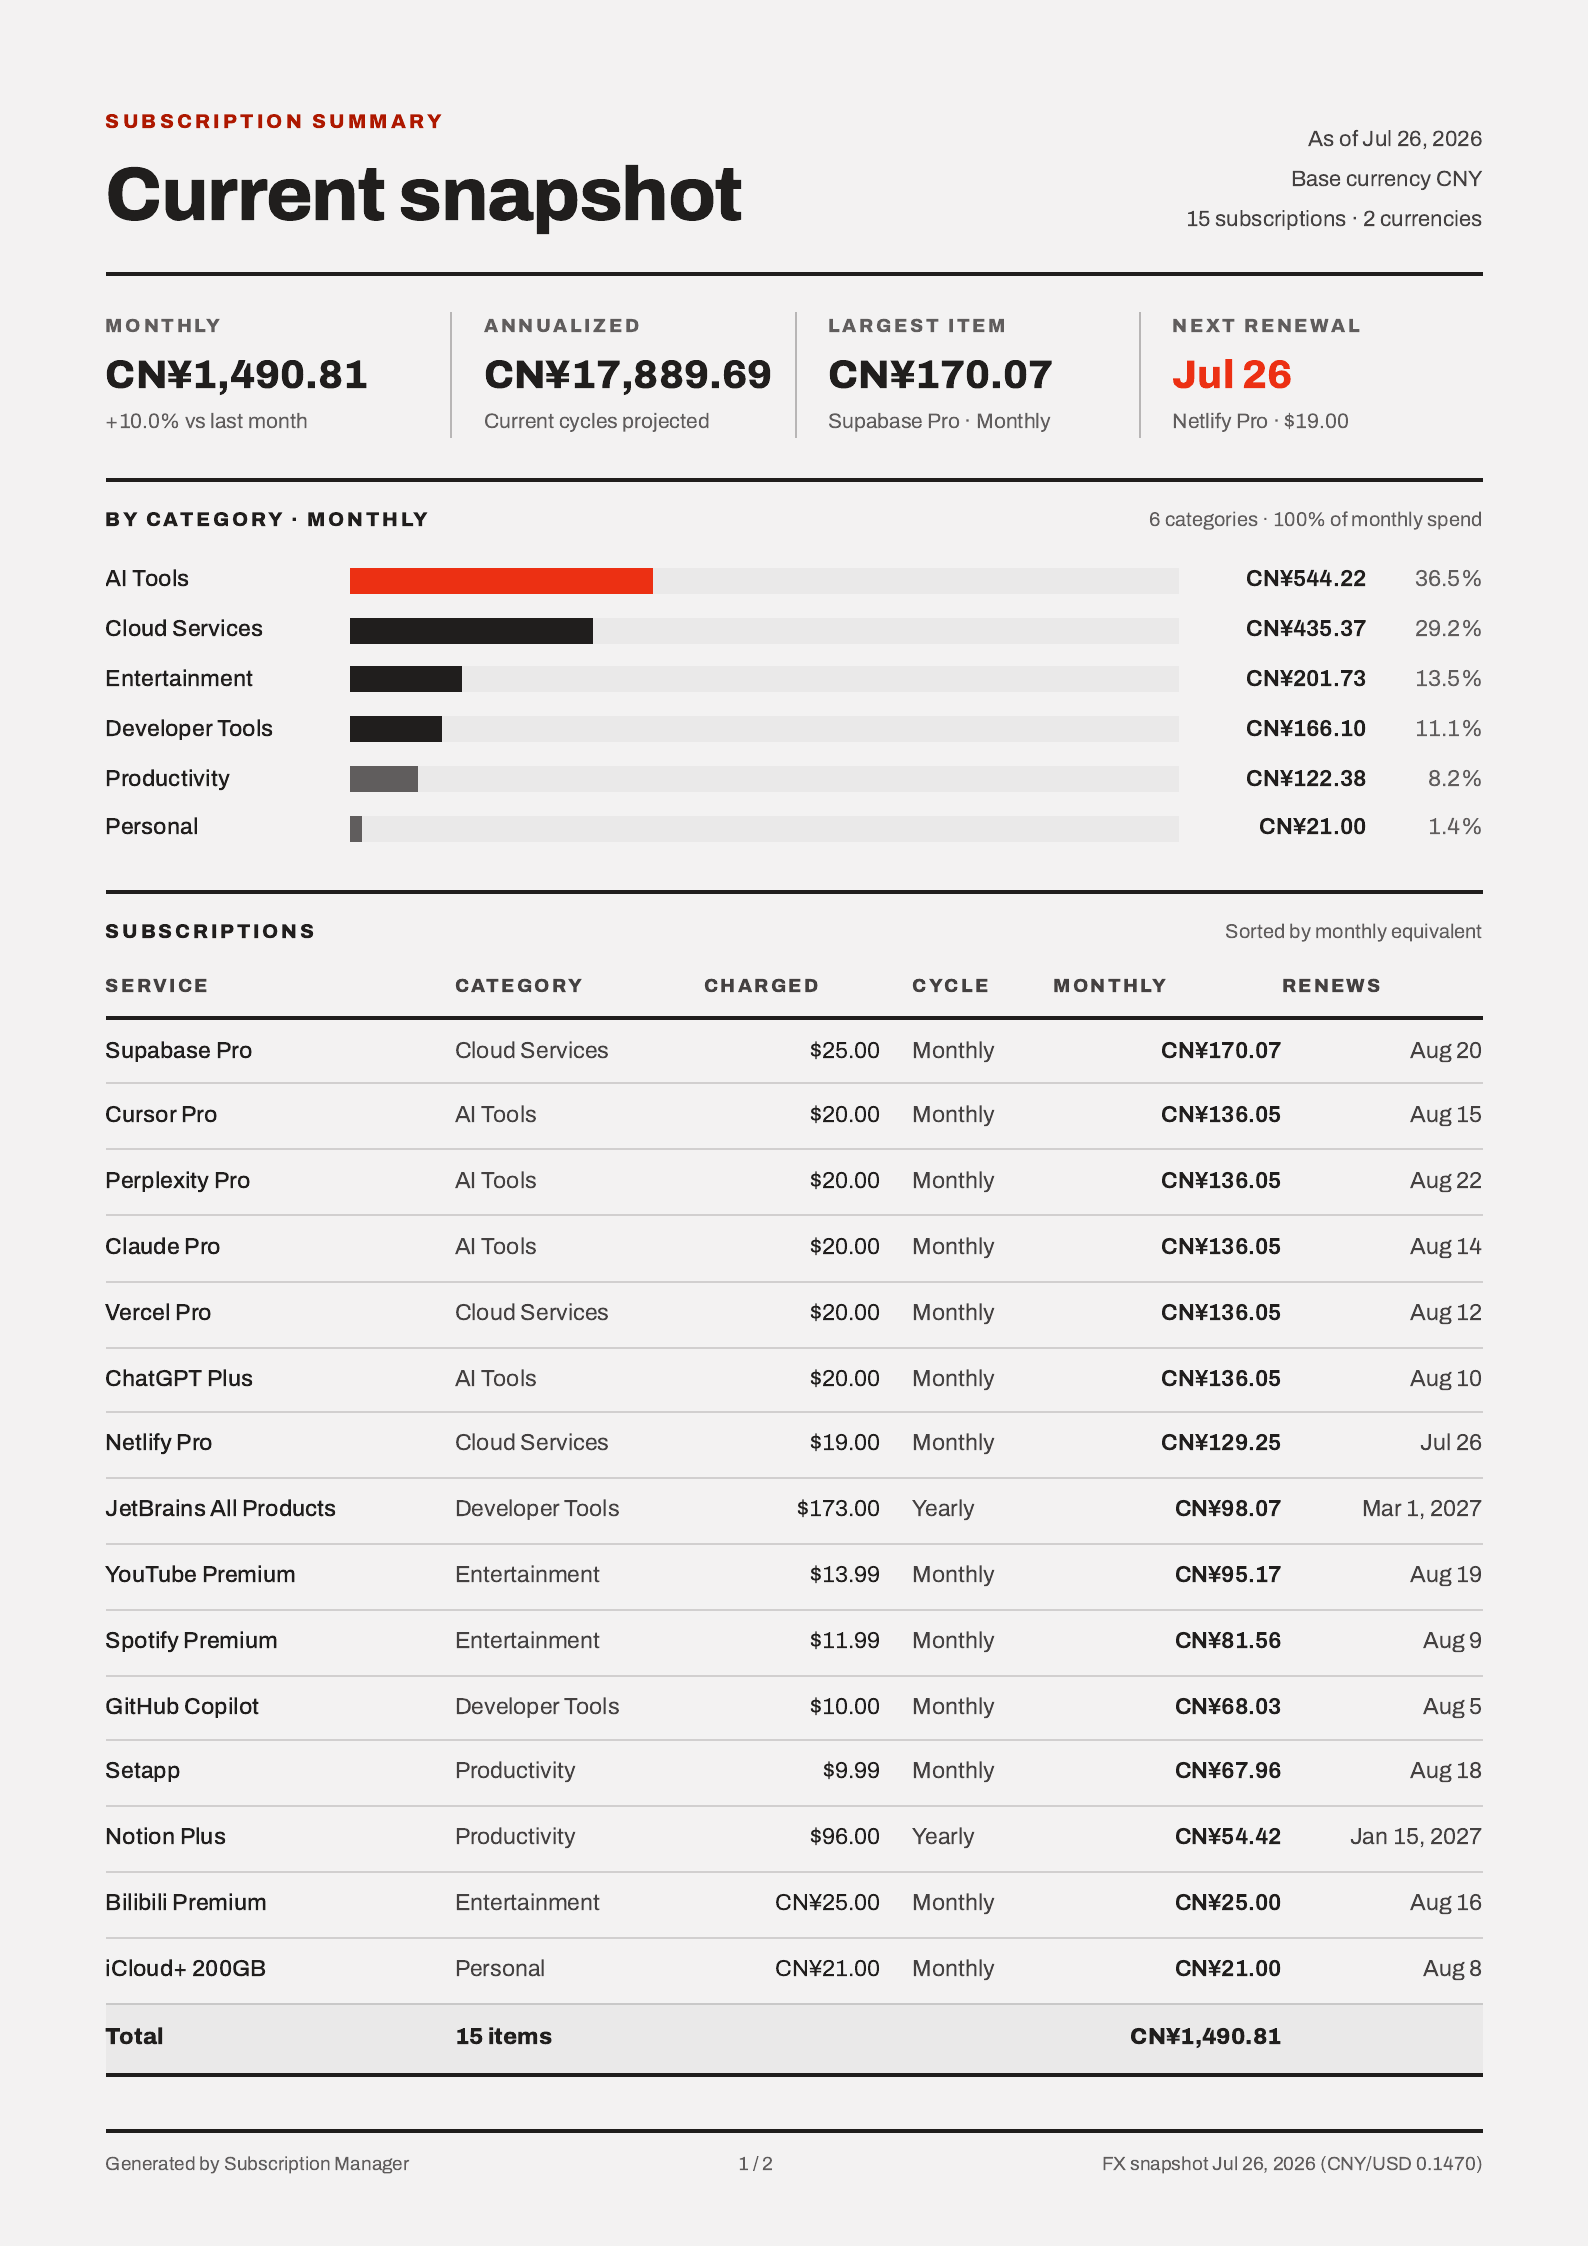
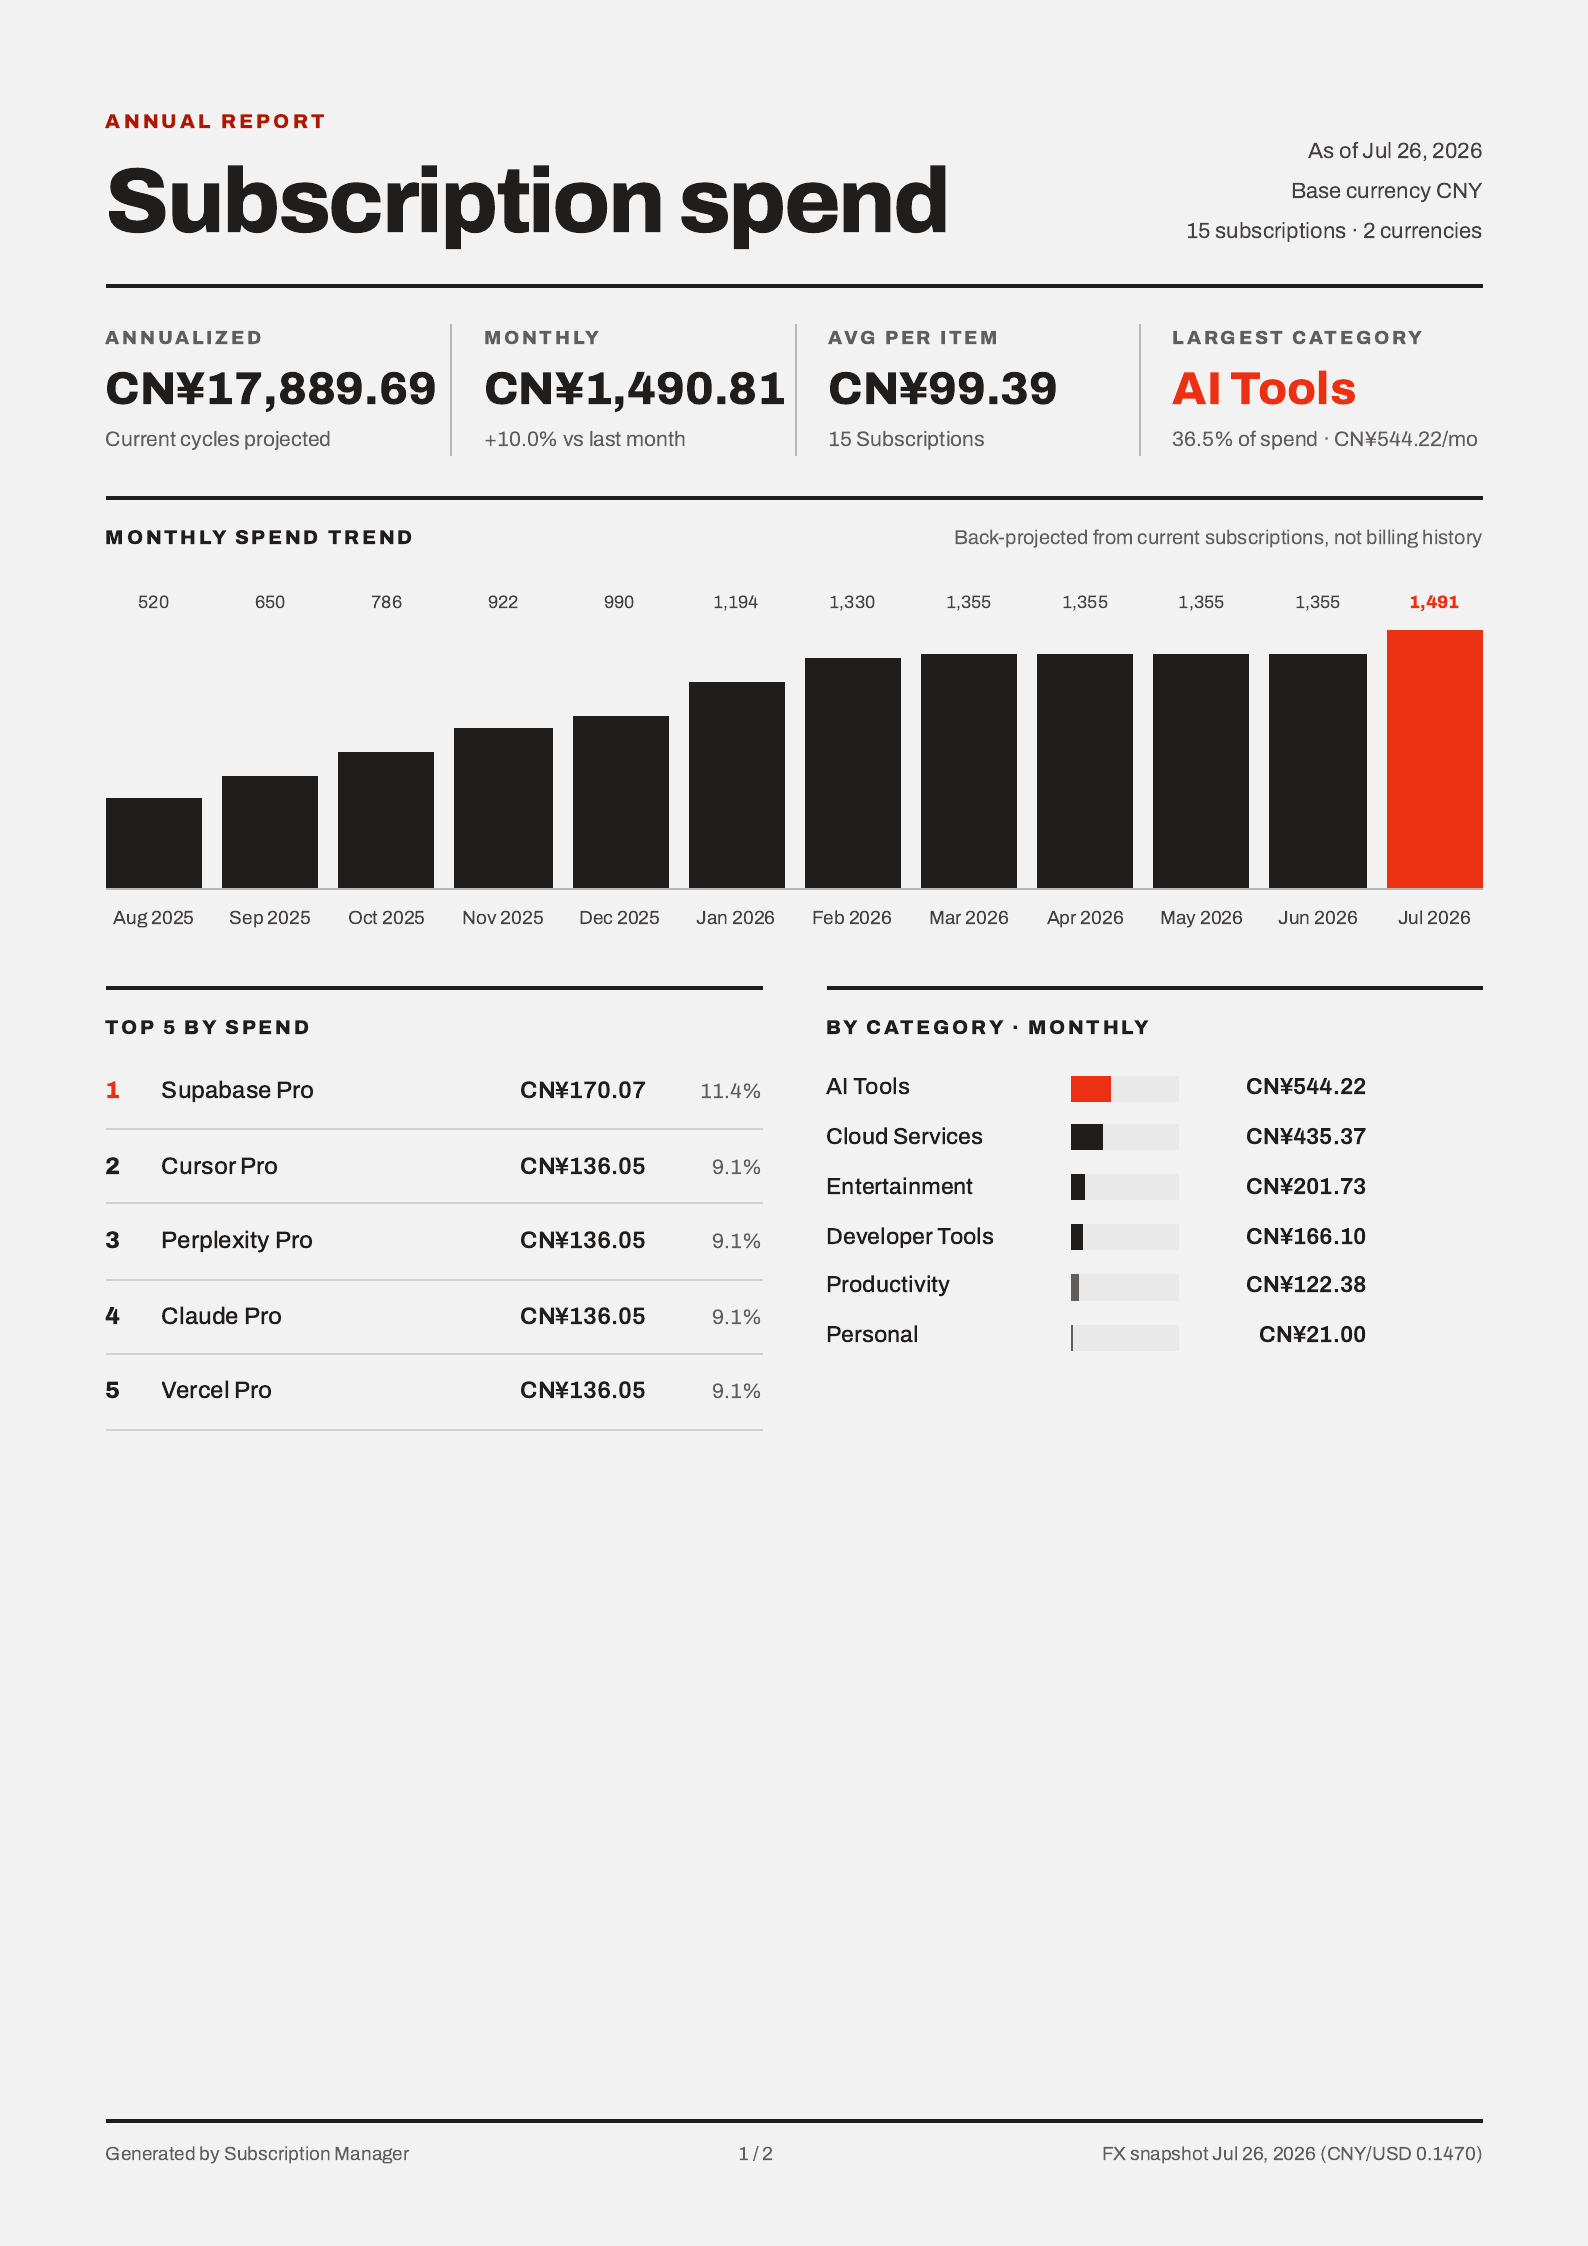 Choosing an export opens your browser's print dialog with the report laid out on A4 pages. Select **Save as PDF** (or a printer) to finish.
## Notes
* The report is generated entirely in your browser. Subscription data does not leave your device to produce the PDF.
* The export follows the app language, so the same report is available in English and Chinese.
* The monthly spend trend is back-projected from your current subscriptions and their creation dates, not from billing history.
* The footer records the export date and the exchange-rate snapshot used for conversions.
This documentation is built and hosted on [Mintlify](https://mintlify.com), a developer documentation platform.
Choosing an export opens your browser's print dialog with the report laid out on A4 pages. Select **Save as PDF** (or a printer) to finish.
## Notes
* The report is generated entirely in your browser. Subscription data does not leave your device to produce the PDF.
* The export follows the app language, so the same report is available in English and Chinese.
* The monthly spend trend is back-projected from your current subscriptions and their creation dates, not from billing history.
* The footer records the export date and the exchange-rate snapshot used for conversions.
This documentation is built and hosted on [Mintlify](https://mintlify.com), a developer documentation platform.